You're paying for HubSpot. Your team logs in daily. Deals move through pipelines, emails go out, workflows fire.
Everything looks fine. But is it?
After auditing hundreds of portals as a HubSpot Platinum Partner, I can tell you: most portals are silently leaking revenue. Duplicate contacts inflate your bill. Zombie workflows fire on records that no longer exist. Properties nobody uses clutter every form. And your pipeline? It's telling leadership a story that isn't true.
We've distilled everything into 5 MECE pillars (Mutually Exclusive, Collectively Exhaustive) that cover 100% of what matters. This is the exact checklist we use internally — and the methodology behind our HubSpot Audit Tool.
Why Annual Audits Aren't Enough
HubSpot portals degrade organically. Every new hire adds properties their way. Every campaign spawns lists that never get cleaned. Every departing employee leaves orphan records and broken workflows behind.
The compound effect is real. Think of it like technical debt — except it's data debt, and it corrupts every report and decision downstream.
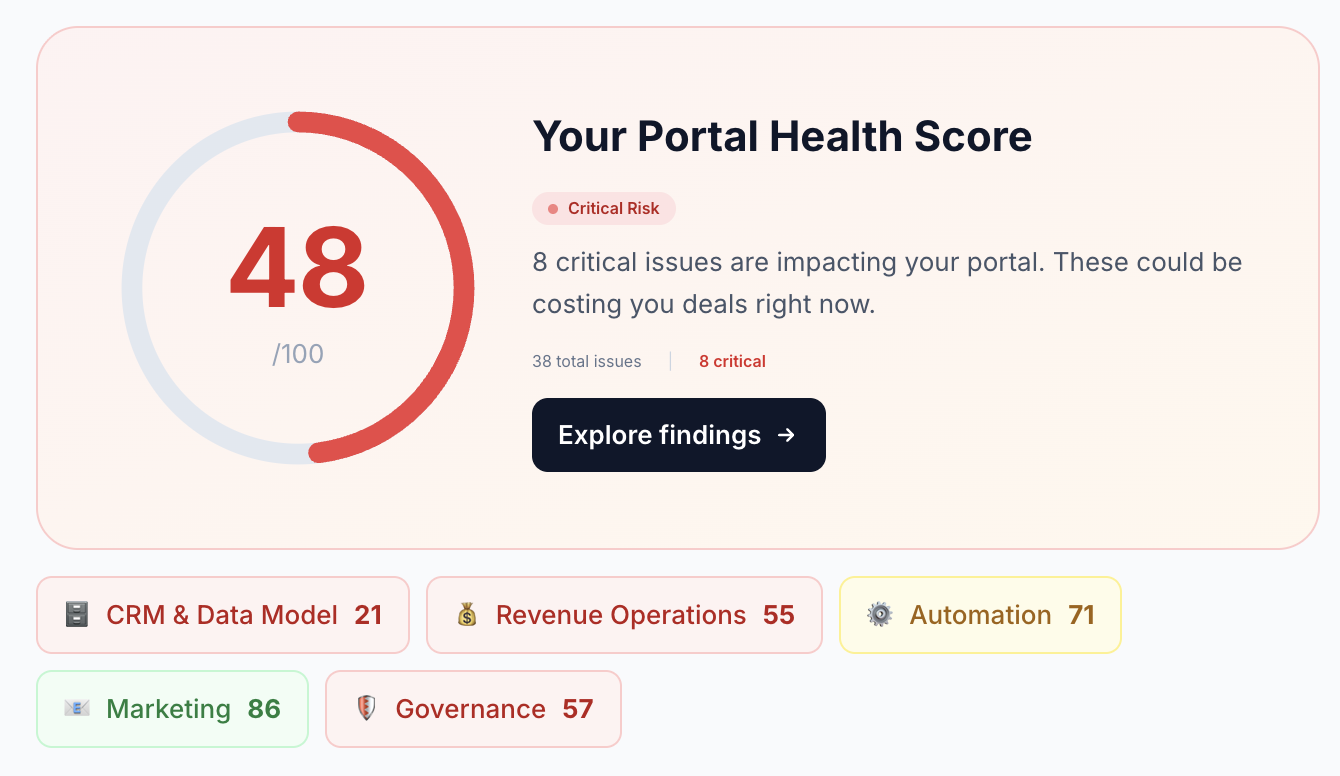
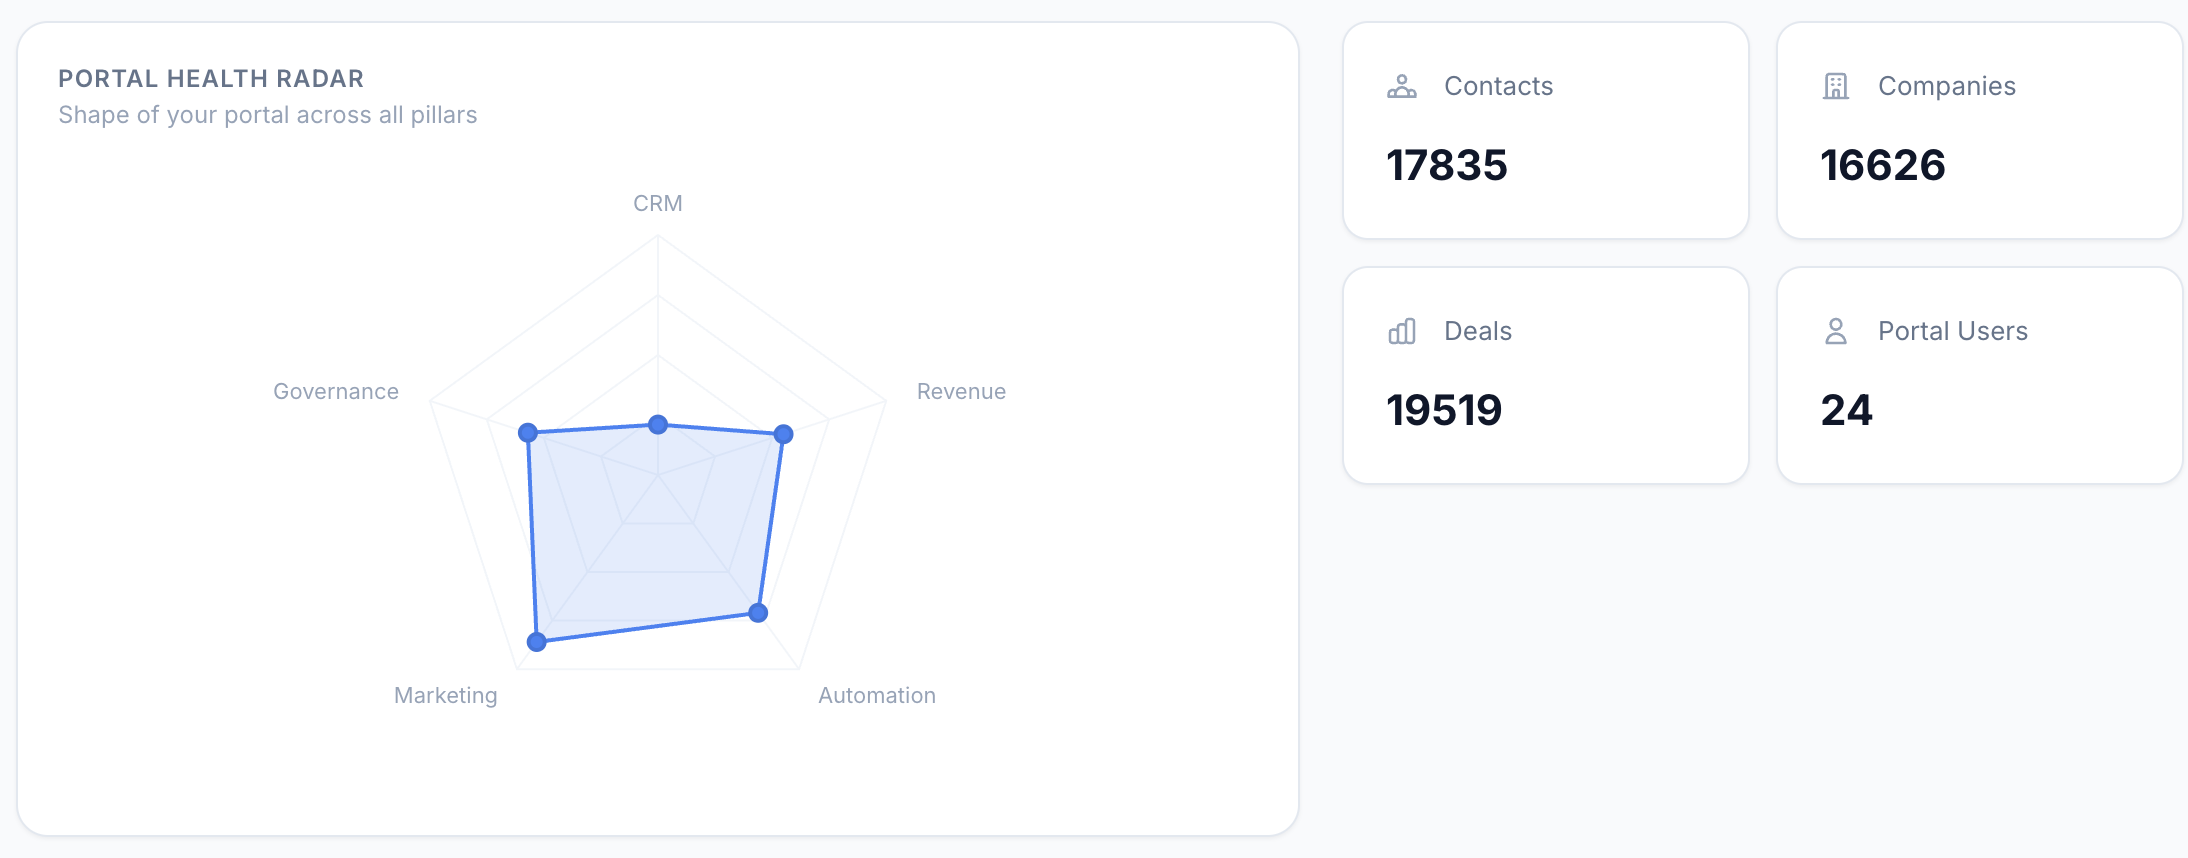
Your portal gets a weighted health score across all 5 MECE pillars
Pillar 1: CRM & Data Model (30% of Health Score)
This is the foundation. If your data model is broken, everything built on top — reports, workflows, integrations — inherits those problems.
What you're checking
Property hygiene, data completeness, naming conventions, conversation health, and association gaps across all CRM objects.
Property & Schema Audit
- Naming conventions: Look for duplicates like
company_sizevscompanySizevsCompany Size. Inconsistency kills reporting. - Unused properties: Below 5% fill rate? Candidate for archival. Most portals have 30-50% dead weight here.
- Property types: Phone numbers stored as text? Dates in inconsistent formats? Wrong types break everything downstream.
- Custom property count: Over 200 custom properties per object is a red flag.
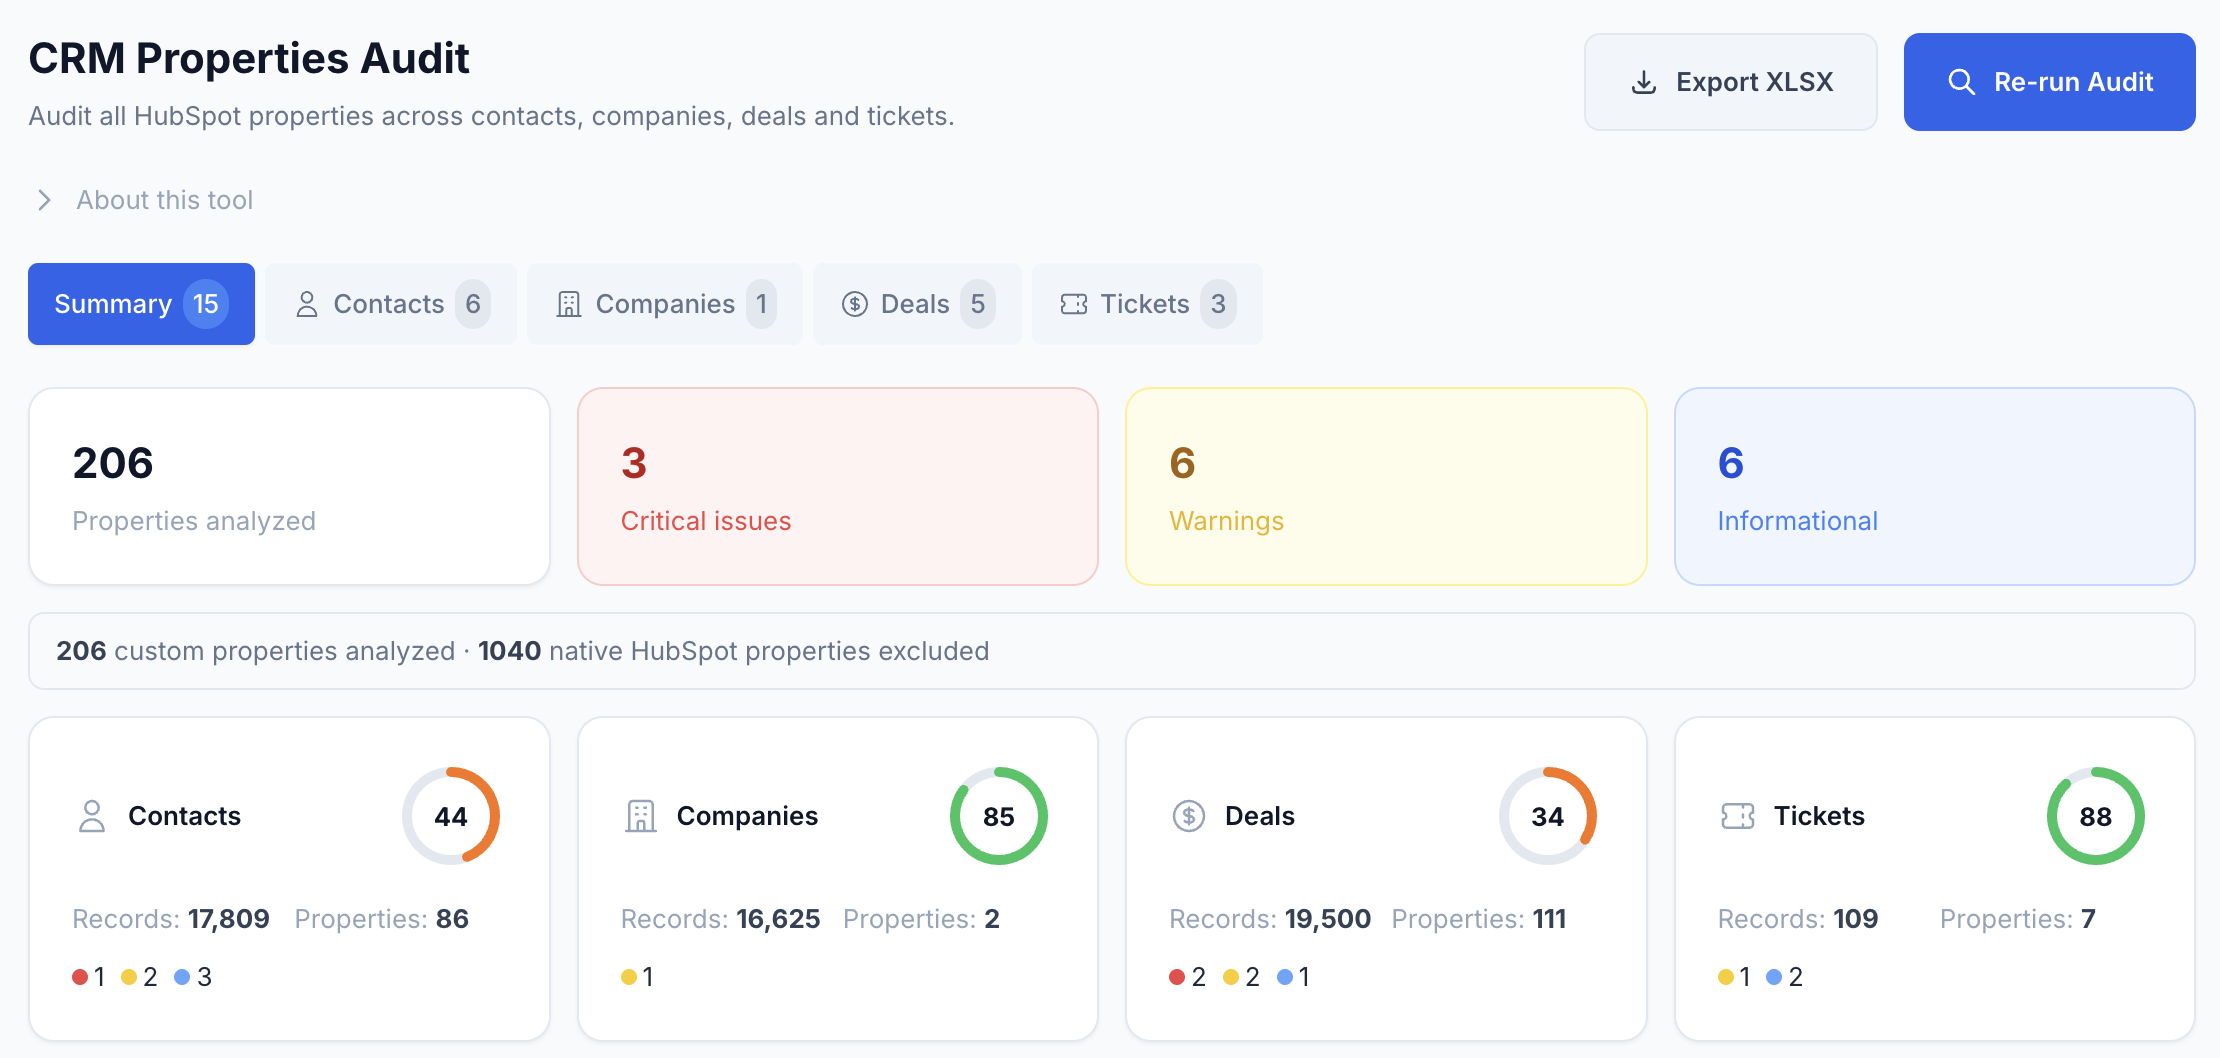
The property audit scores each CRM object independently — Contacts, Companies, Deals, and Tickets
Data Quality Audit
- Completeness scores: What % of contacts have email, phone, company, and lifecycle stage filled in?
- Consistency: Is "United States" vs "US" vs "USA" fragmenting your reports?
- Association gaps: How many contacts have no company? How many deals have no contact?
Conversations Audit
- Response times: What's your average first-response time by channel?
- Unreplied threads: How many open conversations have zero outgoing messages?
- Contact association: Conversations with no linked contact = lost context.
- Backlog health: How many convos have been open for 30+ days?
Pillar 2: Revenue Operations (30% of Health Score)
This is where the money is — literally. Pipeline and lifecycle problems directly hit your revenue forecast.
Pipeline Audit
- Win rate accuracy: If your team reports 40% but reality is 12%, that's a data entry problem disguised as a sales problem.
- Stuck deals: Deals sitting at 2x the average stage duration are pipeline pollution.
- Stage probabilities: Still using the default 20/40/60/80/100%? Nobody ever calibrated those.
- Empty stages: Zero deals in 90 days? Review for removal.
- Pipeline sprawl: More than 5 deal pipelines usually means process fragmentation.
Lifecycle Stage Audit
- Funnel shape: Bottom-heavy (too many customers vs leads) or top-heavy (all subscribers, no MQLs) reveals process gaps.
- Stage skipping: Contacts jumping Subscriber to Customer? Your marketing-sales handoff is broken.
- Bottleneck detection: Which stage has the highest dwell time? That's your conversion bottleneck.
Pillar 3: Automation (15% of Health Score)
Workflow Audit
- Zombies: Active workflows with zero enrollments in 90+ days. Clutter that occasionally wakes up to cause damage.
- Error rates: Workflows with persistent errors are silently breaking your processes.
- Duplicate logic: Three different lead assignment workflows? You'll get race conditions.
- Broad triggers: "Contact is created" without filters = unintended enrollments everywhere.
- Missing suppression: Are your workflows respecting opt-out preferences?
Pillar 4: Marketing (10% of Health Score)
Email, Lists & Forms
- Draft emails: Untouched for 30+ days? Clean them up.
- Bounce rates: Above 2% = sender reputation damage.
- Orphan lists: Not used in any workflow, email, or report? Delete them.
- Stagnant lists: No new members in 90 days? Still relevant?
- Zero-submission forms: Never got a submission? Remove or fix.
- Field overload: More than 7 form fields tanks conversion rates.
Pillar 5: Governance & Security (15% of Health Score)
Users, Permissions & Integrations
- Ghost seats: Users not logged in for 90+ days but still on active licenses. You're paying for these.
- Too many admins: More than 2-3 super admins is a security risk.
- Orphan owners: Deactivated users still owning records. Those records need reassignment.
- Ownership imbalance: One rep owns 80% of contacts? That skews every performance metric.
- API health: High error rates or usage spikes signal integration problems.
- Scope creep: Are integrations requesting more permissions than needed?
How to Score Your Portal
The Weighted Formula
Overall Score = (CRM × 0.30) + (RevOps × 0.30) + (Automation × 0.15) + (Marketing × 0.10) + (Governance × 0.15)
| Score Range | Rating | What It Means |
|---|---|---|
| 80-100 | Healthy | Your portal is well-maintained. Keep auditing quarterly. |
| 60-79 | Needs Attention | Several areas need cleanup. Prioritize by business impact. |
| Below 60 | Critical Risk | Your data is actively hurting business decisions. Act now. |
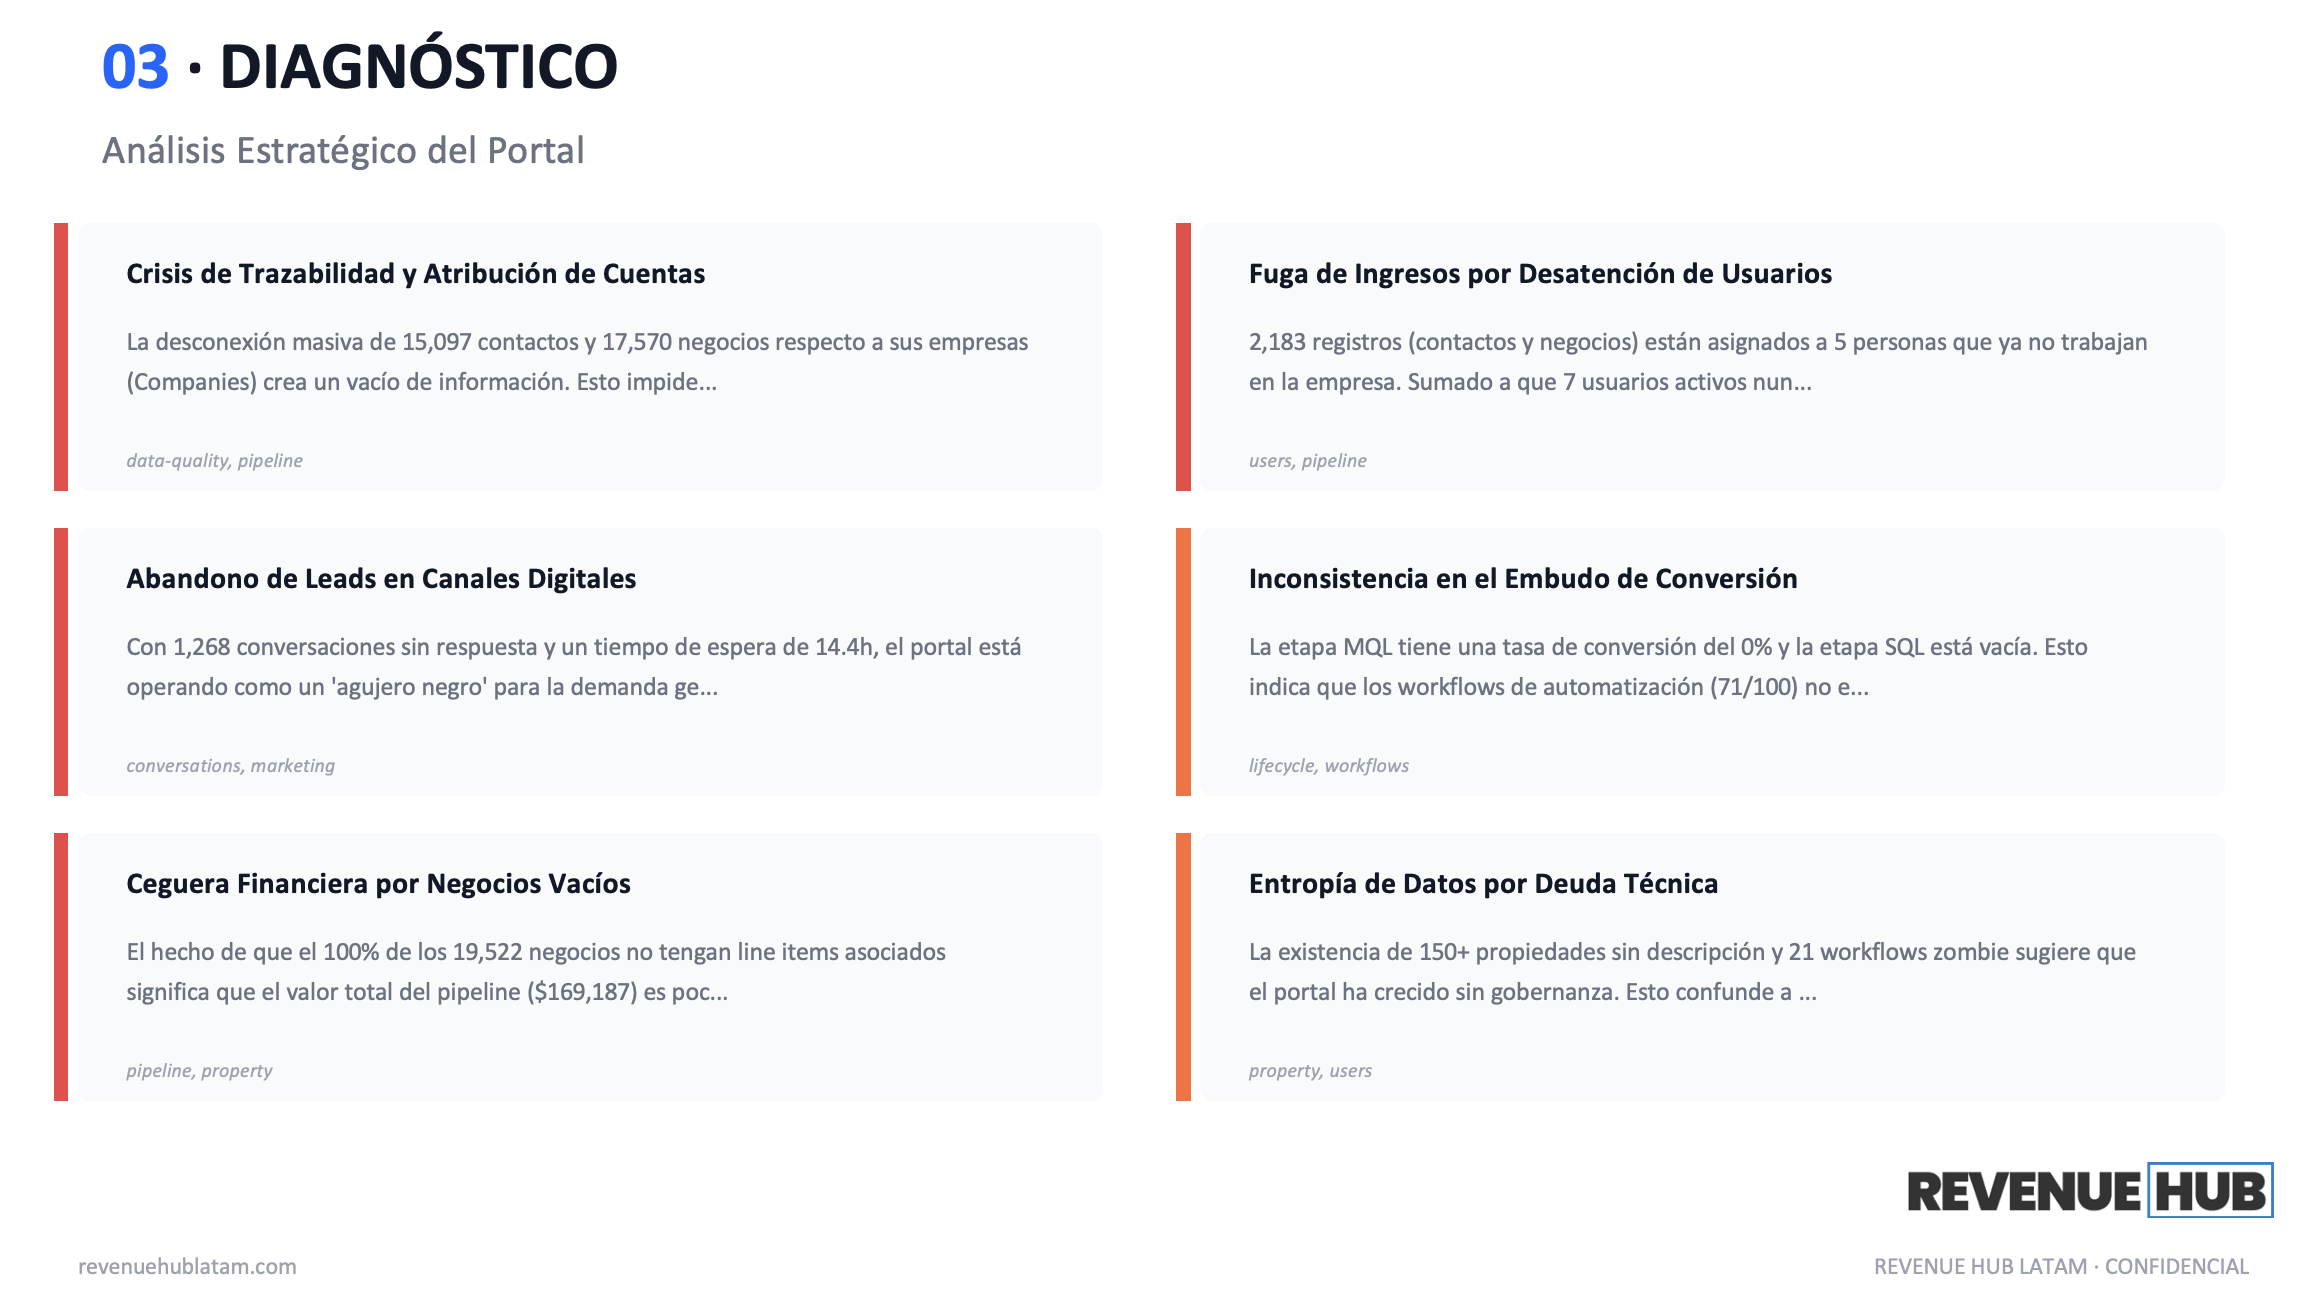
The AI-generated executive summary turns raw audit data into board-ready strategic insights
Skip the Manual Work
This checklist works. But doing it by hand? That's 15-30 hours per portal.
We built the HubSpot Audit Tool to run all 11 sub-audits automatically, score each pillar with this exact RevOps-weighted methodology, and generate AI-powered executive reports in Excel, PDF, and PowerPoint.